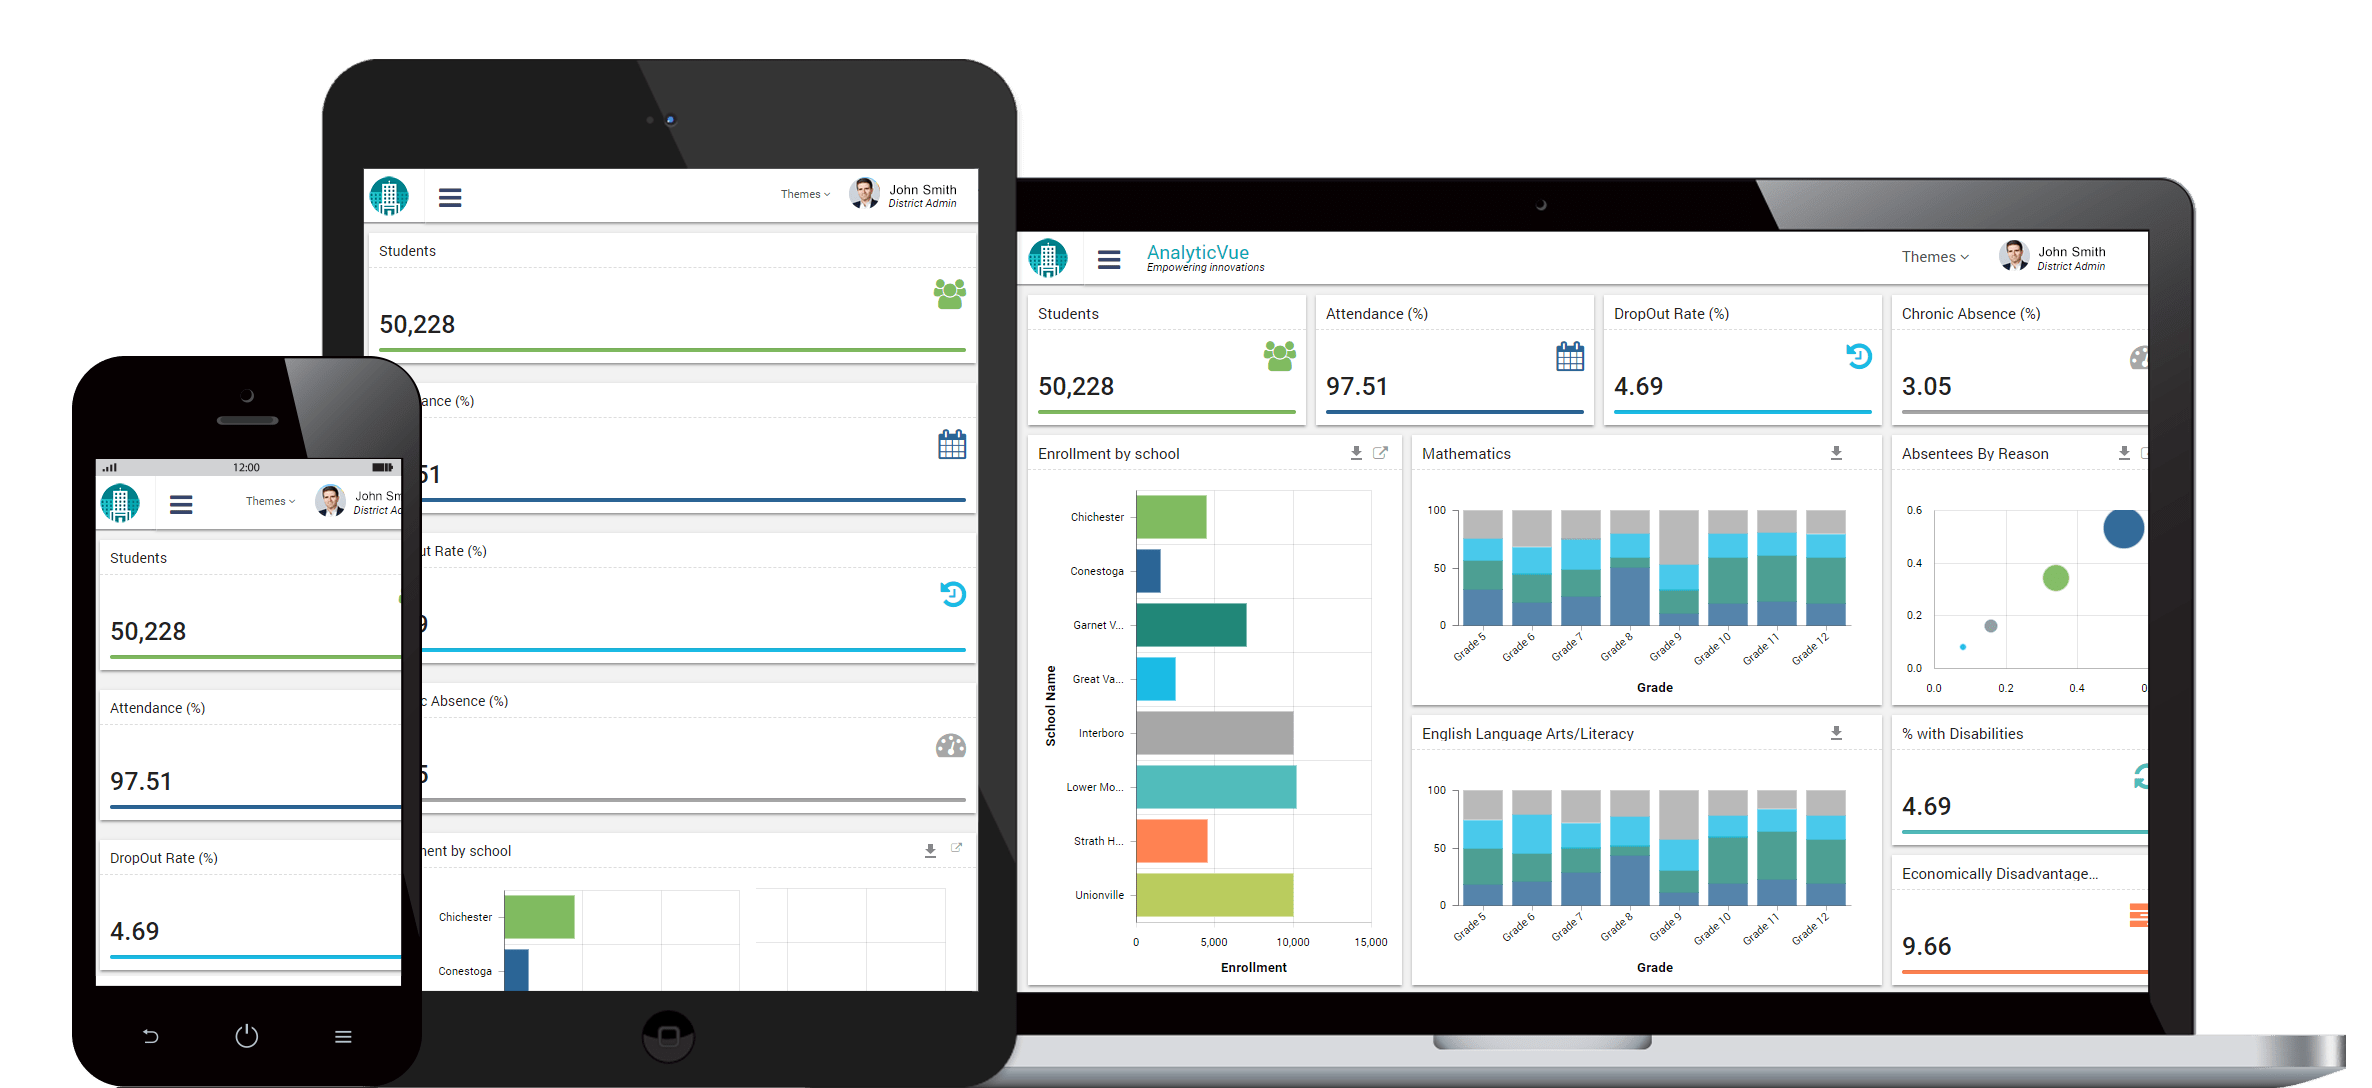
AnalyticVue transforms complex data into simple (secure, role based, easy-to-access, easy to understand) graphical and tabular views. It facilitates meaningful conversations to fuel higher value analysis and encourages actions leading to greater individual and institutional performance. AnalyticVue delivers data and analytics-as-a-service without having to invest valuable resources towards psychometrics, statistics, or an expensive information technology infrastructure.
ESSA Reporting and actionable insights at your fingertips. Drive continuous improvement with AnalyticVue.
AnalyticVue provides greater insights into student progress, runs predictive analysis to identify high-risk students, and provides multi-tiered, personalized insights that are required for effective MTSS.
By simplifying the collection of data from various sources, AnalyticVue helps identify and validate patterns within and across institutions. AnalyticVue provides valuable insights that will support informed decision-making ranging from organization-wide policies to student-specific learning plans.
Easy to access and understand analytics assists teachers as they develop curriculum mapping and learning interventions while predicting performance and determining competencies that help personalize student learning.
AnalyticVue helps decision-makers to optimize associated processes and allocate critical resources to increase success rates, while reducing dropouts.
In partnership with clients and vendors, we have been able to incorporate API....
AnalyticVue's data workflow takes data, from a raw state, turning into information and insight that can guide action.
The product allows data imports/ uploads from disparate data sources such as student information systems, flat file templates, SIF services or any third-party sources.
Our optimized data processing mechanism will help detect duplicate data entries at the initial stage of the data loads, and help in preparation of Delta data loads focusing on changes in the information.
Our extensive experience in education has taught us that every organization has disparate and custom datasets that they need to analyze. To address that need, AnalyticVue provides three options to configure your data imports:
Information optimizes all aspects of administration, which is why exporting your data is never more than one click away.
Data can be exported in various formats such as CSV, PDF, JSON, Excel or GIF in either created templates, or using standards like SIF, or Ed-Fi.
AnalyticVue provides the ability to analyze data within, and across, different domains, and provides tools such as filters to analyze specifics such as trends and anomalies.
Faster intervention on downward trends: Don't wait for the end of a marking period to find out what needs attention. AnalyticVue offers you timely KPI reports and notifications for better informed decision making/ talent management activities.
The metric threshold monitoring functionality indicates the students at risk for dropping out or disengaging, empowering administrators to intervene early. Students with similar physiognomies can be grouped to monitor their progress from day one. Users can create metrics of risk indicator thresholds based on data such as tardy rates, chronic absent rates, course failures, suspensions, performance, and more.
AnalyticVue dashboard management provides administrators, principals, and staff with single overview of several educational key performance indicators (KPI). The views are drillable to provide the necessary level of detail.
The Every Student Succeeds Act (ESSA) is a US law passed in December 2015 that governs the United States K-12 public education policy.
ESSA leaves significantly more control to the states and districts in determining the standards students are held to. States are required to submit their goals and standards and how they plan to achieve them to the US Department of Education, which must then submit additional feedback, and eventually approve.In doing so, the DOE still holds states accountable by ensuring they are implementing complete and ambitious, yet feasible goals.
Users can use or customize existing templates, or create their own by defining the required fields for capturing the data into the application. In the process of a field's configuration, users can also set properties such as data types, lengths and business rules for data cleansing during data imports.
Create and manage your own datasets within or across domains by using built-in functions and filters.
Using Data Visualizer, you can generate and share reports using these datasets for further analysis.
Create and share your own dashboards. Using Dashboard designer not only helps
add/customize/download any kind of dashlets but also can rearrange them into a dashboard that best serves your vision and needs.
AnalyticVue has a built-in Data Visualizer framework for representation of data through the latest state-of-the art reporting mechanisms that help to dynamically create reports.
Data Visualizer helps take data based on existing datasets, or external files, and allows the user to instantly customize the report.
Data Visualizer has the flexibility of creating reports without needing to store the data into the system
AnalyticVue has a built-in business rule engine to register, define, classify, manage, and if needed, customize the rules based on your data and business needs.
AnalyticVue offers Plug & Play capabilities with any third-party tools such as Power BI, Tableau, QlikView, Cognos, Dundas, and Domo.
AnalyticVue API eliminates duplicate data entry by integrating with any application, service, or product that offers API functionality.
The Advanced Analytics component of AnalyticVue efficiently uses Machine Learning (ML) and Artificial Intelligence (AI) to empower organizations to unlock the insights within their historical data. By analyzing student patterns, these predictive models are unique in providing critical information that enables those in charge of students' learning to take effective decisions to improve student
AnalyticVue can predict how well a student will perform at school, as well as any risk factors that might hinder that success. AnalyticVue's "What-If" analysis tool helps teachers to identify the specific gaps in students' performance, and plan the interventions to make them perform better.
Collecting survey data can be like herding cats. Make it easy for your team to create, administer, and report on surveys people want to take.
For pricing, please contact avadmin@choice-solutions.com
Boon IT delivers world class services by addressing business challenges and drive transformational growth. We offer state-of-art solutions that are customized to exceed expectations of small-to-medium business and large enterprise clients.
5734 Brendlynn Dr
Suwanee GA 30024
avadmin@choice-solutions.com